

Using node.js and Xively with Arduino Mini Pro to graph motion sensor data
Before you start reading this article. This is not a tutorial, these are my documented findings while tinkering with Arduino, I have much to learn having in mind that I have been playing with these toys for a couple of days.
Recently while visiting my good friend Igor Stamatovski, I have told him that I plan to build an air quality measuring device and that I have already ordered several items from Aliexpress. I have also told him that I’m anxious to get them and start building it.
Instead of replaying he got up and started going trough the things in a drawer on his work desk.
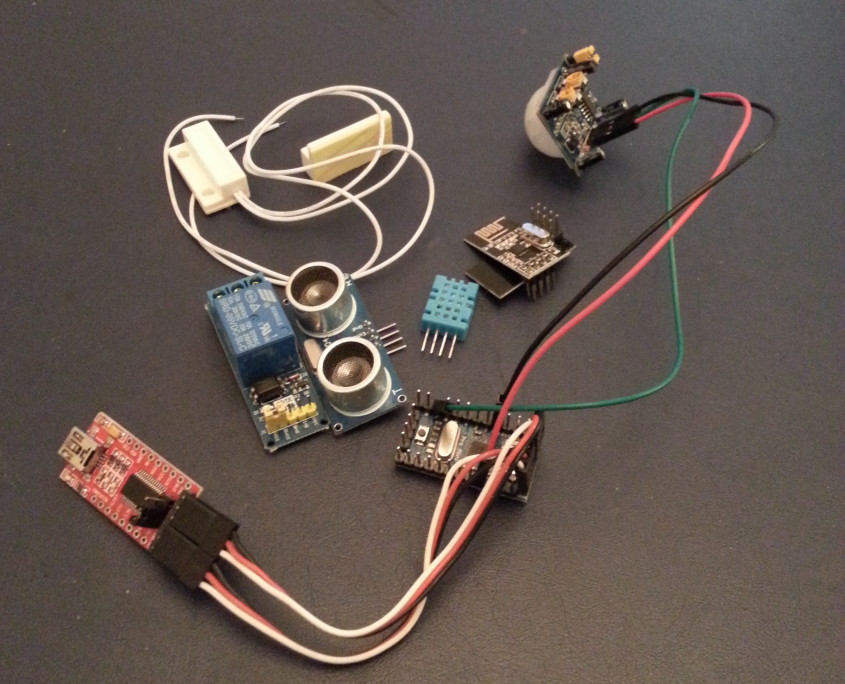
When he returned on my surprise he handed me an Arduino pro mini along with a dozen of sensors.
I have had a previous basic experience with Arduino based electronics and I already knew how to upload a sketch with FTDI because I have previously owned a MultiWii FC and also I had tinkered with a SimpleBGC gimball controller with a broken usb port, but I had no idea on how to connect sensors, get sensor data etc.
So I thought, let’s start with something basic, like just getting the sensor data from a motion sensor.
That was really easy since there are plenty of sketches that can help you get things going. I have encountered only one problem with the pinouts on the sensor since the writing on the board was covered with the plastic sensor casing. After sorting that out, I have the sensor data readouts in the serial monitor.
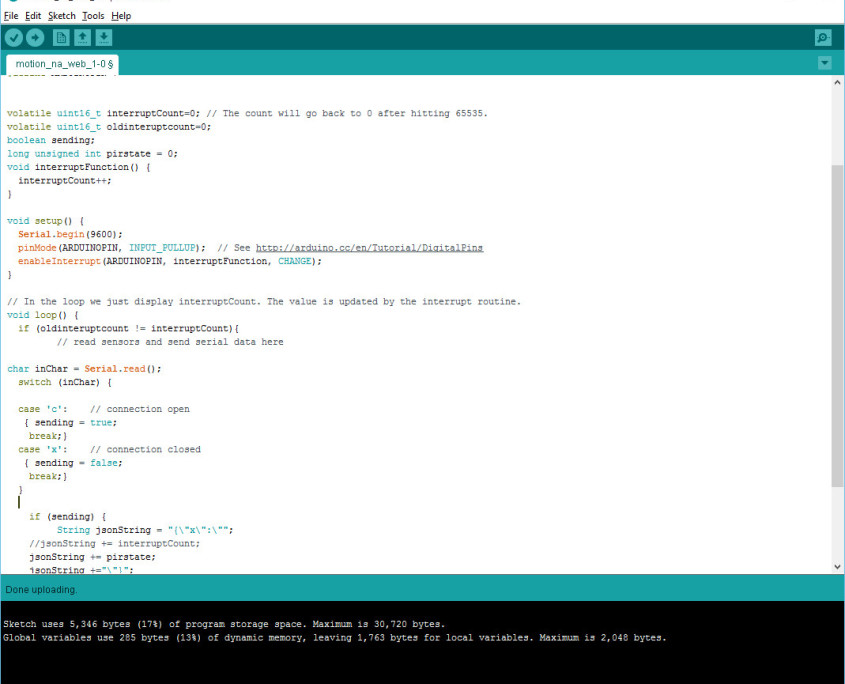
Screenshot of the working version in its final phase. Nevermind the code cleanness, this is v0.0.0.0.1 my only goal was to make this work. You can download the sketch here.
My next thought was, ok, I have the data in the serial monitor, but I have no use of it at the moment, I will need a way to at least have that data readout on a local web server.
Using the Arduino pro without a wifi shield, the only way to get the data is by using the serial port. So I needed something that could access the serial port on my computer, read the data and display it on a webpage. I know that if I had wifi shield the things would have been much easier, but I had to work with the parts that I already had.
After doing a short research on google, I have found that node.js fits the task perfectly.
Now I have a knowledge of JavaScript, but I have never had a chance to play with node.js. Luckily I have found this tutorial. Please note that the GitHub link is not working, The correct one is this.
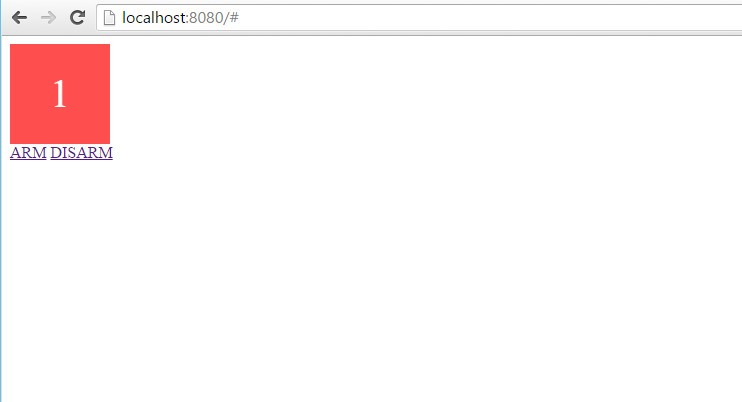
By following the tutorial and slight modifications in order to get it working with my sketch, I have managed to get the data displayed on a local web server. I have also added two buttons on the webpage that will request data and stop the request when we don’t need it, this is acting as an arm/disarm switch for the sensor. This was previously done automatically on client connect/disconnect.
Next step, graphing the data, displaying when the sensor was triggered.
I was looking for an IOT solution where I could send the data and have a graph and I have decided to go with the personal edition of Xively since there are a lot of people using it already and it was really easy to send the data by using Jquery and the provided JS library.
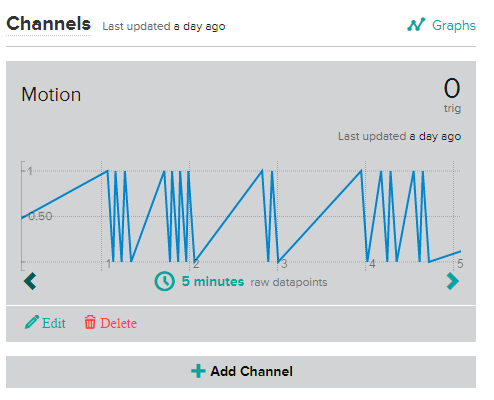
And finally, each serial event will post data on Xively and the graph will display values varying between one and zero.
If you are interested to try this experiment, feel free to download the source files here.


Leave a Reply
Want to join the discussion?Feel free to contribute!